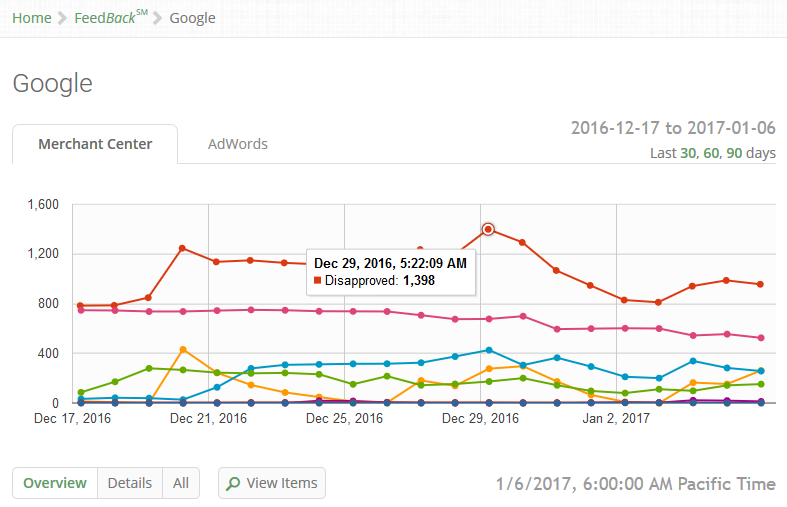
VersaFeed has released a powerful new feature called FeedBack, which enables merchants to see detailed information on the health and status of their data feed. FeedBack will appear as a new top-level menu item in the client accounts and can be launched by navigating to FeedBack > Google.
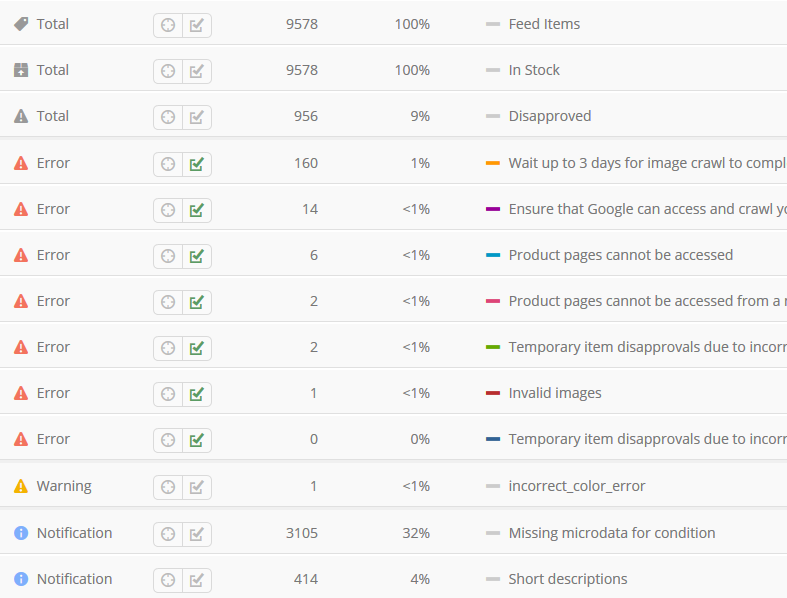
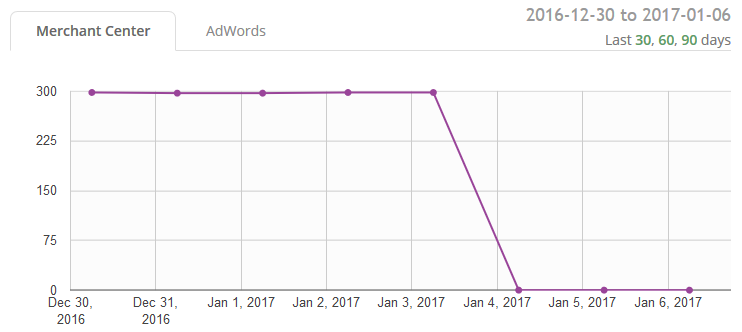
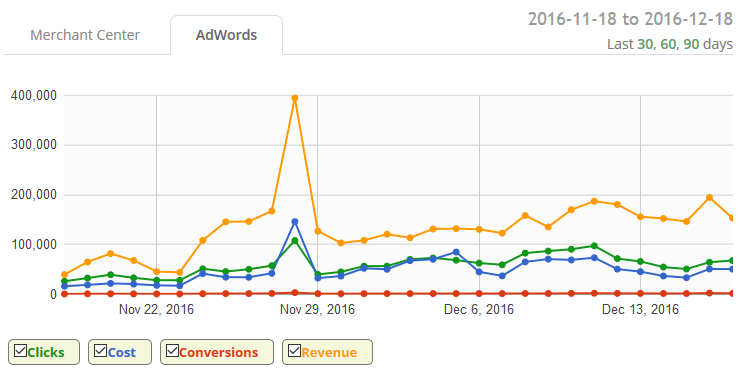
FeedBack charts various issues and metrics in your Merchant Center feed and AdWords account over the last 30 days. In the upper right, you can click "60" or "90" days to adjust the time range. Below the Merchant Center chart is a table containing each of the individual metrics which can be isolated or combined to see specific issues. Let's look at both of these features individually:
Chart options
Switch between chart modes with these three buttons below the chart: 
- Overview: Default view, showing total items, in-stock items, and disapproved items
- Details: Selects all errors that your feed has experienced
- All: Selects both the default view (total, in-stock, and disapproved) as well as all errors
You can also select any combination of particular feed issues. To select one individual issue, simply click the  (Show solo) icon. To select multiple issues, click the
  (Show/Hide) icons.
Time range
Quick links for the "Last 30, 60, 90 days" are available at the top right for adjusting the time period of the chart. You can also change the URL parameters manually if you need more specific dates. For example, if you wanted to see the first week of December 2016 you would add the following to the URL:
?start_date=2016-12-01&end_date=2016-12-08
Example usage
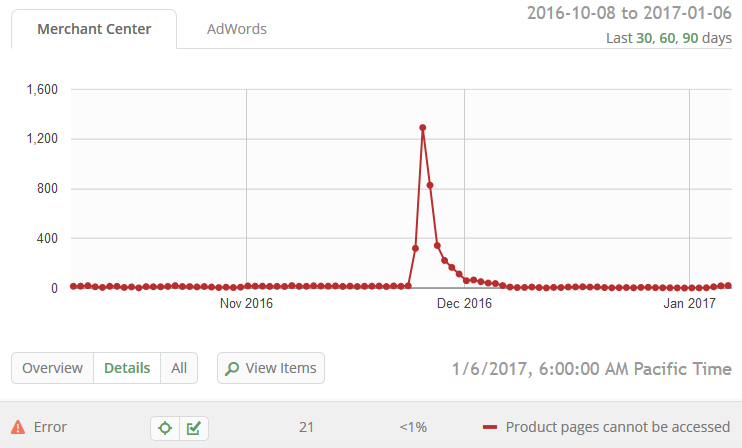
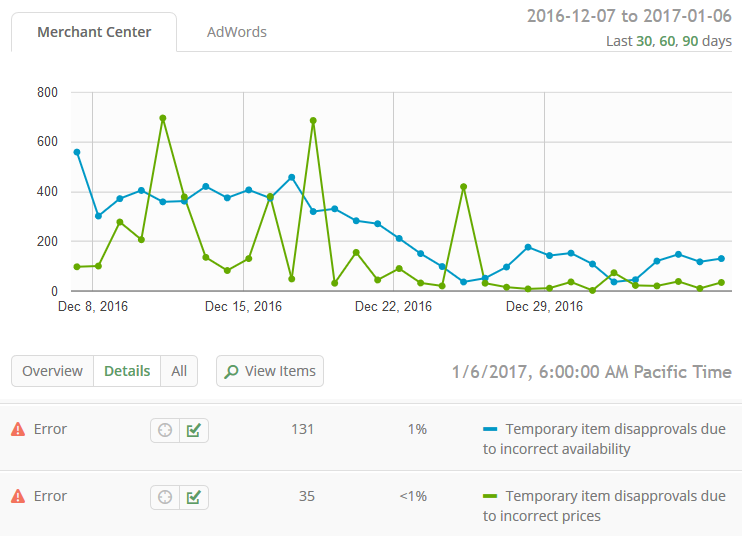
Giving users the ability to drill down on individual feed issues and chart them over time opens up a new world of insight and debugging opportunities...

Viewing individual items
Lastly, for power users, there is a "View Items" icon directly under the chart that will take you to a special feed search page showing only items exhibiting the errors that you selected. For example, if you are tracking down image issues in your feed, you might select both "Invalid images" and "Incorrect image encoding" within FeedBack, and then click "View Items".

You will then be directed to our "Feed Search" page and shown your most recent Google feed — but the page will only display items with the image issues you selected. Using this method, you can now reliably view and fix issues within your Google feed with laser precision.
We hope you enjoy using FeedBack as much as we enjoyed creating it. Please don't hesitate to reach out if you have questions or comments.